200 Years of Lake Champlain Ice Data – Climate Change in Action

200 Years of Lake Champlain Ice Data – Climate Change in Action
One of the best-understood facets of climate change is that global temperatures are rising overall. Since the turn of the 20th century we know that average temperatures have gradually risen every decade, and they will continue to rise more rapidly throughout the 21st century. What does this mean for the Northeast, and specifically for Lake Champlain?
Change is already evident. Over the past 50 years both New York and Vermont have experienced an average annual temperature increase of about 0.5°F per decade, or 2.5°F total since 1970. Low temperatures are rising much more quickly than high temperatures. While the average maximum temperature during the summer months (June, July and August) rose 0.15°F per decade, the average maximum temperature of winter months (December, January and February) rose four times that rate – at 0.64°F per decade. This directly affects winters in the Champlain basin, making them both milder and shorter within living memory.
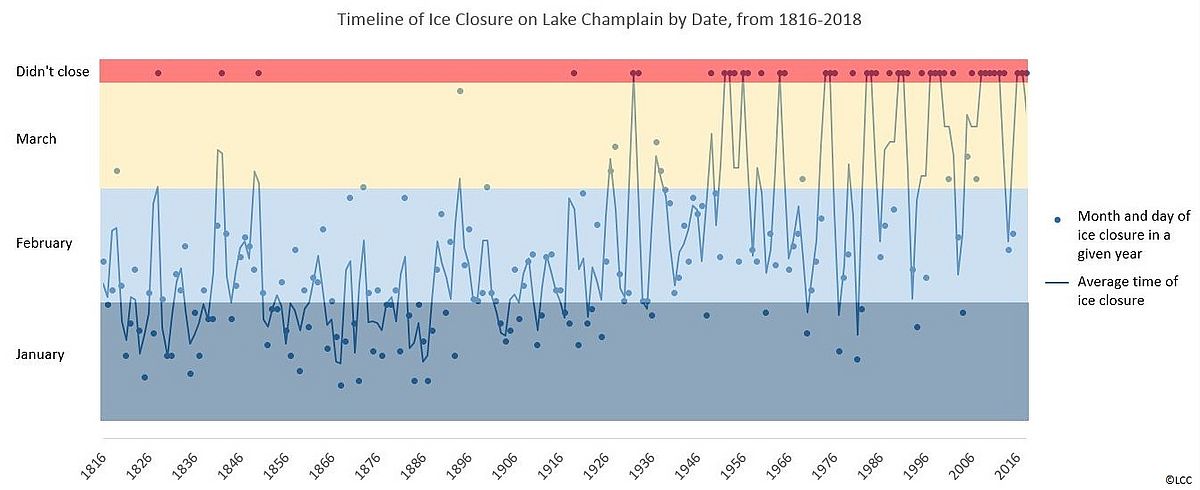
Due to warming winter temperatures, Lake Champlain does not ice over as often as it did even 20 years ago. The freezeover that happened this month is now a rare and celebrated event. The chart above represents a timeline of when the ice on Lake Champlain has closed, from 1816 when recording first began to present day. Each dot on the chart marks the date of ice closure each year. The months are shown along the vertical axis, while the years are arranged chronologically at the bottom. Where each dot lies within a month’s span shows whether ice closure happened earlier or later in the month. If the ice didn’t close at all the dot for that year appears in the thin red bar along the top of the chart.
The trendline zig-zagging down the center of the chart reveals how quickly the average date of ice closure has changed in recent decades. Between the early 1800s and the early 1900s the lake typically froze over in January and early February, and the trendline rarely leaves those months. However, as time went on Lake Champlain began freezing later and later in the year. In the early 1900s the average date of ice closure moved into February, and in the 1950s it peaked closer to March. Beginning in the 1990s Lake Champlain became more likely not to freeze over at all.
As the charts show, the 1950s appear to be the turning point when Lake Champlain experienced not only a greater frequency of freezing later in the year – in mid-February or early March – but of ice not closing at all. Lake Champlain hasn’t frozen over in January since 2004. This March, 2019, represents the first time the lake has frozen over completely in the past four years.
To learn more about the effects of climate change on the Lake Champlain watershed, visit LCC’s webpage.